Data Collection
I monitored my students' progress by using three different data collection methods: AimsWeb second-grade math application and concepts benchmarks, AimsWeb second-grade math computation probes, and a disposition survey.
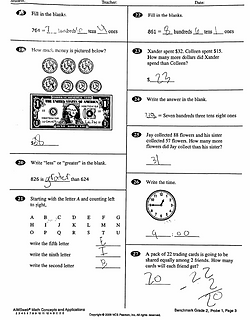
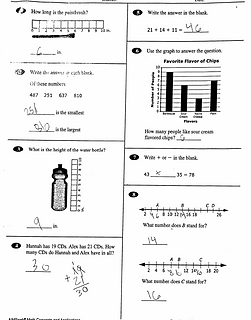
Application and Concepts
The math application and concepts assessments were used as my t-test. I gave the first benchmark prior to beginning the number sense interventions, and the second benchmark after seven weeks of the intervention had taken place. This assessment had a variety of different skills that measured mathematic achievement. The test was administered in a paper-pencil format in favor of a computer. I measured the number of problems answered accurately in a given amount of time as well as the total accuracy. The students were given the test and told to begin. After eight minutes passed, I went around and put a star on the last problem they completed before the eight minute mark. The students then completed the remainder of the test. This same process was used for both the pre-test and post-test implementation. Each problem on the assessment had a predetermined number value. For example, one of the problems could have been worth one point and the next problem could have been worth three points. If the student correctly answered the question, they received the full amount of points for that problem. If they did not answer the question correctly, they received zero points.
Computation
The computation probes were administered weekly. The first probe was given prior to the number sense interventions being implemented, but were then given once every Friday thereafter. These assessments included single and double-digit addition and subtraction. They were also given in a paper-pencil format. For this assessment, the student only had eight minutes to complete as many of the problems as possible. If the student finished before the eight minutes expired, the time of completion was written on the top of the paper. Just like the concepts and applications assessment, each problem on the assessment was assigned a predetermined score. The students received full points if they got the problem correct, or no points if it was incorrect. If they did not finish a problem, they received zero points. Each probe was based on a 50 point scale.
Disposition Survey
The disposition survey was given before the number sense interventions were implemented and after six weeks of action research were completed. There were three statements on the survey and three answer choices. For each statement, the student could choose always, sometimes, or never. The three statements were: I like learning about math, I am good at math, and I feel confident using math vocabulary.
Why were the data collection methods chosen?
I chose to monitor the progress of my students by using the aforementioned data collection methods because they were best for my students. My purpose statement was to measure math achievement, which is why I chose the math concepts and application assessment for my pre- and post-test. The AimsWeb second-grade concepts and application assessments measured a variety of different math skills including, but not limited to the following: story problems; computation; measurement; interpreting data; geometry; fractions; and place value. From my research I learned that number sense impacts all math concepts, which is why I decided that the best measure of mathematic achievement for my students would be the concepts and application assessment from AimsWeb. Knowing my students and their needs, I knew that they would not be able to finish the pre- and post-test within an eight-minute time frame. In spite of that, I wanted them to finish the entirety of the assessment, even if it took more than eight minutes, so that I could measure their accuracy on all concepts assessed. That is why I decided to take note of their progress when the first eight minutes expired, while still allowing the students to continue taking the assessment until they were finished. This gave me the ability to analyze if the t-tests showed an increase in number of problems completed accurately within the eight-minute time frame, as well as if the total accuracy altogether increased after the interventions were implemented.
The research I conducted also suggested that math computation fluency should increase with a heightened sense of number sense. Since my students were already familiar with timed computation assessments, and there is a research-based correlation between computation and number sense, I decided to use the eight-minute AimsWeb computation probes as a weekly progress monitoring tool. I felt that my students would be able to complete, or get close to completing, the computation assessments within the eight-minute time frame, which is why I decided to measure their accuracy on problems completed within that time limit.
The disposition surveys I created were built around the needs of my students. I wrote them in student friendly language and we discussed what each statement meant before they gave their answers. I gave them three answer choices as well as a visual to match. I did this because of my students’ reading needs as well as one of my student’s English Language Learning needs. I knew that I needed a visual to help them pick an accurate answer choice for each statement. I chose the three statements because of the research I conducted prior to implementing the interventions. I learned that a child’s attitude and confidence in math is directly correlated to their math achievement. I also learned that a critical part of math achievement is being able to use math vocabulary to discuss concepts, which is why I chose to include the third statement in the disposition survey.
Using Assessment Information to Inform Decisions
During the course of the study, progress was continuously monitored. AimsWeb computation probes were given weekly, which were used to analyze progress. Informal observational data was also recorded daily. The computation probes and observational data recorded throughout the six weeks of action research helped me to make informed decisions and to change my interventions when needed, based on student progress.
Observational data was recorded every day during all interventions implemented. Each day during warm-up, the students completed a number of the day worksheet. While they were doing this, I observed areas of strength, areas of difficulty, and how quickly they completed each section. This provided a daily baseline of where the students were at and how they were progressing. I also recorded observational data during each intervention area (number lines, place value, hundreds chart, linear board games/mystery number, and story problems) and guided my instruction based on their performance in each. For example, I noticed during week three that my students were confident in place value, but needed more practice with number lines. This observational data allowed me to change my original action plan and spend two days on number lines, and work on place-value during warm-up. I also noticed during week four that my students did not seem to be using as much math vocabulary as I wanted them to use, so I elected to spend more time having students complete think-alouds and story problems. These changes in my action plan were all based on the observational data that I recorded throughout my project.
The computation probes that were administered weekly also helped me assess progress. I graphed each student's scores on a weekly basis so that I had a visual representation of their growth. On week three I noticed that one of my students was continuing to regress each week on the computation assessments. This regression was a red flag to me, so I implemented a daily computation exit ticket to practice the skill. The computation data that was collected during the course of the study helped me to make the interventions more meaningful for my students.


Data Analysis
The data from the Math Concepts and Applications pre-test and post-test suggested that both students made progress. On the pre-test, Student B scored seven out of 50 points inside the eight-minute time limit. Without the eight-minute time limit, the student scored 15 points. After implementation of the intervention, the student scored eight points on the post-test inside the eight-minute time limit, and 20 points without the time constraint. Student C scored 13 points on the pre-test inside the eight-minute time limit, and 19 points without the time limit. On the post-test, Student C scored 16 points inside the eight-minute time limit, and 23 points without the time constraint.
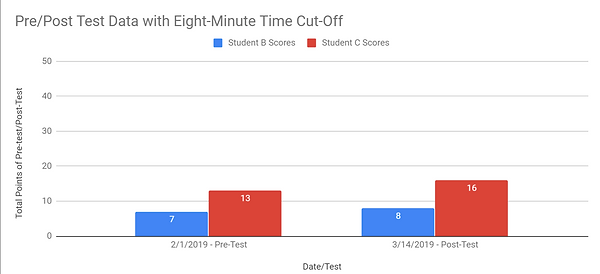
When analyzing the data from the pre- and post-tests administered inside the eight-minute time limit, it was apparent that Student B did not show much growth between the two assessments. This matched my observations in the classroom during action research. This student took a lot of time to complete math problems; she was always the last one to complete the number sense activities. Knowing that her processing speed was slower than a typical student her age, the lack of growth within the eight-minute time constraint was not surprising. Student C showed slightly more growth than Student B between the pre- and post-tests administered inside the eight-minute time limit. Student C had faster processing speed than Student B, but still took his time to solve math problems to the best of his ability. Both Student B and Student C spent more time solving math problems than typical students their age, which was understandable due to their diagnosed disabilities. Small growth in this area is growth nonetheless.
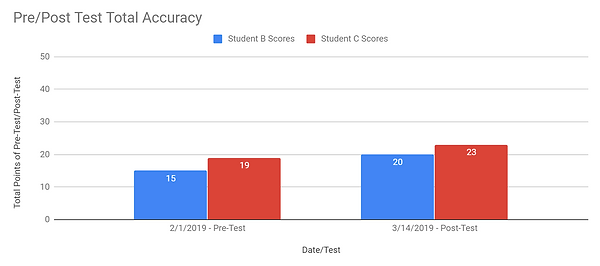
When analyzing the total accuracy of the pre- and post-tests for Student B and C (no time-limit constraint) it was obvious that growth was made for each student within the six weeks of number sense instruction. Student B started out with a score of 15 out of 50 points on the pre-test, which equates to 30% accuracy. After six-weeks Student B scored 20 out of 50 points on the post-test, which equates to 40% accuracy. This student, who had a verified learning disability in the area of math, gained 10% accuracy with six-weeks of number sense instruction. This data tells me that the number sense intervention was beneficial for Student B. Student C scored 19 out of 50 points on his pre-test, which equates to 38% accuracy. On the post-test, he scored 23 out of 50 points, which equates to 46% accuracy. Student C gained 8% accuracy in six-weeks of intervention. This data indicated that the interventions implemented were also helpful to Student C.
I also monitored my students’ progress throughout the number sense interventions by giving them a weekly computation assessment. On the baseline assessment, both students scored 34 out of 50 points. From there, both students’ scores fluctuated.
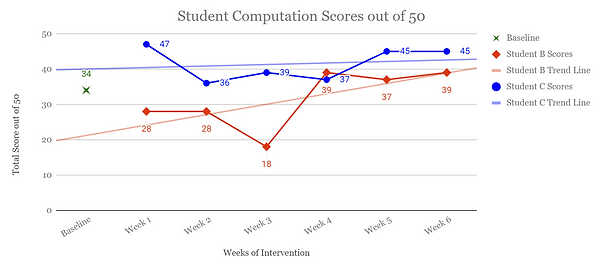
Student B’s accuracy decreased from the baseline assessment in weeks one through three. In fact, in week three, she scored only 18 out of 50. At that point I asked myself why her scores were dropping and I made the instructional decision to make a change. I realized that when the baseline assessment was given, second-grade was on the last week of Topic 11, which was triple-digit addition and subtraction. This topic gave Student B and C repeated practice of computation skills. The next week, which was when the number sense interventions began to be implemented, the grade-level math switched to a different topic, which meant that daily computation practice was no longer occurring in the classroom. Based on that observation, I decided to implement daily double and triple-digit addition and subtraction problems in the form of exit tickets. Once this was implemented in my action research, Student B’s weekly computation scores significantly increased. She started out by receiving 34 out 50 points, which equates to 68% accuracy. On the last week of intervention, she scored 39 out of 50 points, which equates to 78% accuracy. Much like the pre- and post-tests, Student B gained 10% accuracy with computation after six weeks of number sense interventions. This was substantial growth for Student B.
Student C also made growth in computation. Like Student B, Student C’s baseline was also 34 out of 50 points, which equates to 68% accuracy. On week six, he scored 45 out of 50 points, which equates to 90% accuracy. He increased his computation scores by 22%, which marked significant growth. From the outset, Student C scored in the high 30 point range, but became stagnant during weeks two through four. The computation exit tickets that were implemented in weeks three through six helped this student achieve growth during weeks five and six. One question I asked myself was why week one of the intervention was the highest computation score Student C achieved. When looking back at the computation assessments, I noticed that on week one’s probe, Student C did not miss any subtraction problems. On weeks two through four, Student C missed many multi-digit subtraction problems. I attributed this to the fact that Student C was not receiving practice in multi-digit computation in grade-level math during that time frame. Once the exit tickets were implemented, Student C was able to reach almost the same score as he did during week one.
The final assessment I analyzed was the disposition survey that I gave my students prior to implementing the number sense interventions, and immediately after the action research was completed.
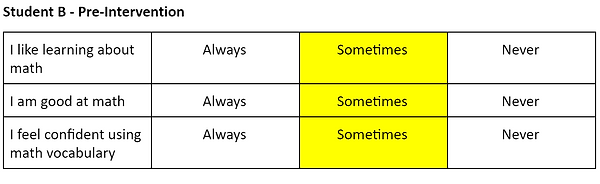
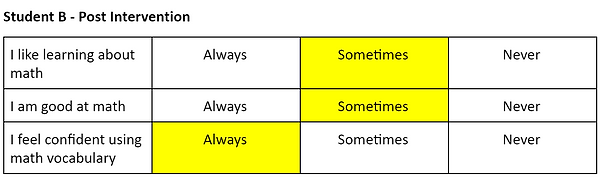
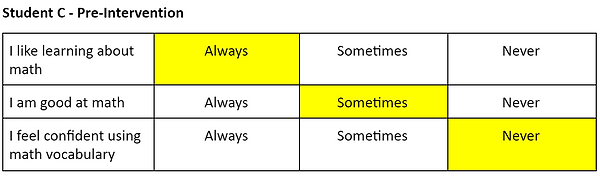

When looking at the disposition surveys, both Student B and C answered the same way on the pre- and post-surveys for the following statements: I like learning about math, and I am good at math. Student B said sometimes for both statements, and Student C indicated the he always liked learning about math and was sometimes good at math on both surveys. The statement that they both changed was “I feel confident using math vocabulary.” Both students indicated that, post-interventions, they felt like they were always confident using math vocabulary. This data revealed that during my implementation of number sense interventions, I did a good job of teaching and encouraging how to explain math concepts using math vocabulary. The use of math talks during all interventions, but especially story problems, helped both students feel more comfortable discussing math concepts. When seeing that neither student changed their feelings about learning math or being good at math, I wondered why. Their grade-level math continuously became more difficult throughout the implementation of action research, and both students struggled with the topics. I believed that was why they both still felt like they were only sometimes good at math. I interpreted that as the students believing that they were good at the number sense activities they engaged in during the interventions, but not good at grade-level math activities. This told me that I needed to give more positive praise in the classroom and promote more positive self-talk when giving grade-level math instruction to both students. I believed that once student B felt like she is always good at math, she would also feel like she always enjoys learning about math.
Triangulation of Data
All three of the assessments that were analyzed can be connected to one another. The weekly computation assessments showed continuous growth, specifically after week three of implementation. The pre- and post-test assessment included computation questions as well as story problems, both of which led the students to solve the problems using computation skills. Student B answered two more computation problems correctly on the post-test than she did on the pre-test, and Student C answered three more correctly. The progress in computation that each student made throughout the interventions helped them to make growth in their post-test assessment, which measured their math achievement. The confidence they gained in math language and vocabulary directly correlated to both the computation and concepts and application assessments. From my research, I knew that when students can explain math in their own words, they have good number sense and perform better in math. The increase of confidence in this area led the students to be more confident when taking the math assessments, which helped them achieve higher scores.
The aforementioned assessment data was proof that the six-week implementation of number sense interventions increased student achievement in the area of math for both Student B and C. All three pieces of assessment data recorded positive growth. Continued implementation of number sense interventions would lead to a deeper understanding of numbers which would lend itself to even higher math achievement.